Leave a Message

By providing your contact information to Zander Realty Group, your personal information will be processed in accordance with Zander Realty Group's Privacy Policy. By checking the box(es) below, you consent to receive communications regarding your real estate inquiries and related marketing and promotional updates in the manner selected by you. For SMS text messages, message frequency varies. Message and data rates may apply. You may opt out of receiving further communications from Zander Realty Group at any time. To opt out of receiving SMS text messages, reply STOP to unsubscribe.

Thank you for your message. We will be in touch with you shortly.

Explore All Homes
Back Bay Investment Outlook: July 2026 Market Report | Zander Realty Group

Back Bay Investment Outlook: July 2026 Market Report | Zander Realty Group

ZANDER REALTY GROUP Market Dispatch — July 2026

Back Bay, Boston  /  Residential Intelligence

The bay windows
are holding firm.

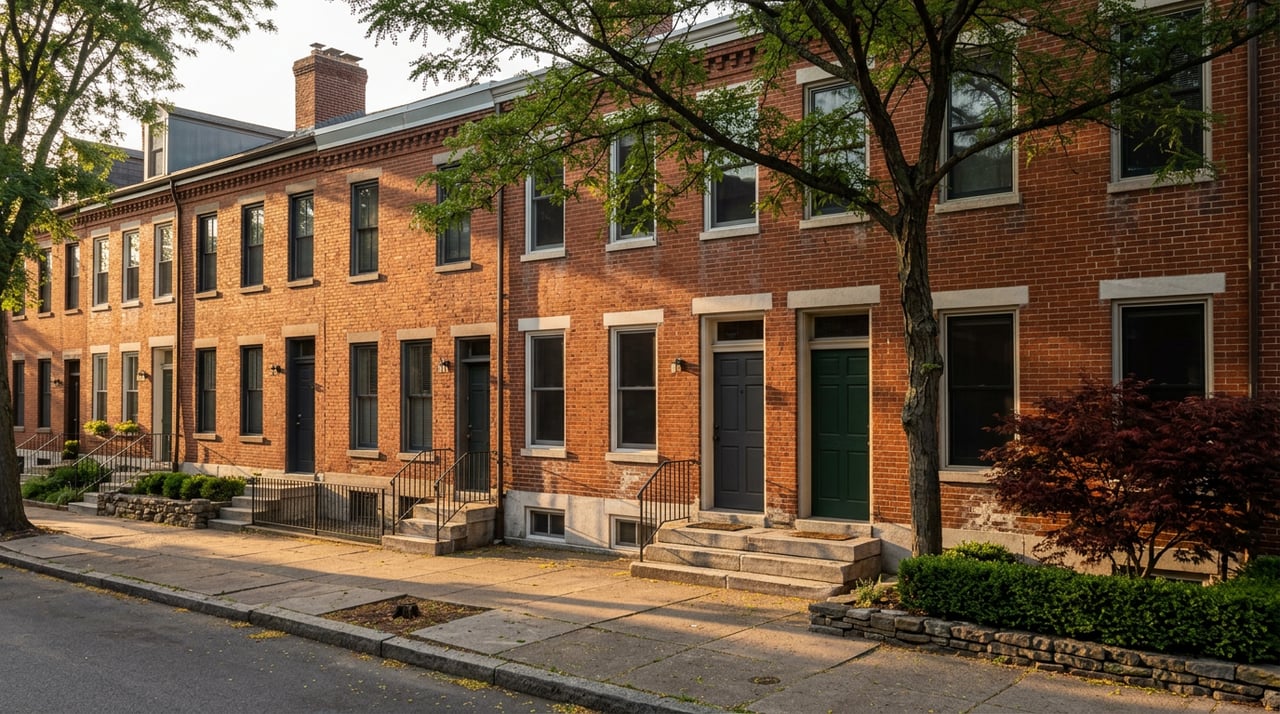
Six blocks of brownstone between the Public Garden and the Fens absorbed a fifth straight month of tightening supply — and buyers paid a premium to get in the door.

$2.12M
▲ 29.8% MoM
Median Sold Price
$71.7M
▲ 24.0% MoM
Total Sales Volume
4.88 mo
▼ 19.9% MoM
Months of Supply

Boston's Back Bay closed July as a seller's market with real teeth — sales volume climbing, listings thinning, and buyers still paying nearly full ask to secure a unit before it's gone.

The neighborhood's granite steps and mansard roofs have always traded on scarcity. This month, that scarcity sharpened. Median sold price rose to $2,122,500, a 29.8% jump from the prior month, while active listings fell to just 117 properties — down 16.4%. For an investor watching a shortlist of Back Bay addresses, the math changed quickly.

Field Notes

Why the ledger favors sellers

Surging Asset Values

Median sold price climbed nearly 30% in a single month to $2,122,500, pulling total sales volume up to $71.7M — a sign of capital moving decisively into premier addresses rather than sitting on the sidelines.

Contracting Inventory

Months of supply fell to 4.88 as active listings dropped to 117 properties. Fewer options on the market historically correlate with steadier long-term value retention and firmer rents for the units that do trade.

Negotiation Leverage

Closings averaged 97.61% of list price with a median of 26 days on market. It's a narrow gap, but a real one — enough room for a disciplined buyer to land an address below its peak ask.

Premium New Stock

What did come to market arrived priced for confidence: a median list of $1.88M (+17.6%) and $1,440 per square foot (+4.5%). Sellers are betting the appetite for Back Bay hasn't peaked — and July's closings suggest they're right.

97.61%

Sold-to-list price ratio for July. Sellers are still capturing nearly full ask, even as buyers gain the first sliver of negotiating room in months.

The Ledger

Metric
July 2026
MoM
Median Sold Price
$2,122,500
+29.8%
Total Sales Volume
$71.7M
+24.0%
Active Listings
117
−16.4%
New Listings
34
−22.7%
Months Supply of Inventory
4.88 mo
−19.9%
Sold-to-List Price Ratio
97.61%
−3.3%

Outlook

Timing the shift

Whether the goal is a luxury condo acquisition or a portfolio diversified with high-yield residential holdings, the current inventory contraction is a narrow window rather than a permanent state. Back Bay's supply has tightened five months running — the addresses that trade in this stretch tend to set the comparables for the year that follows.
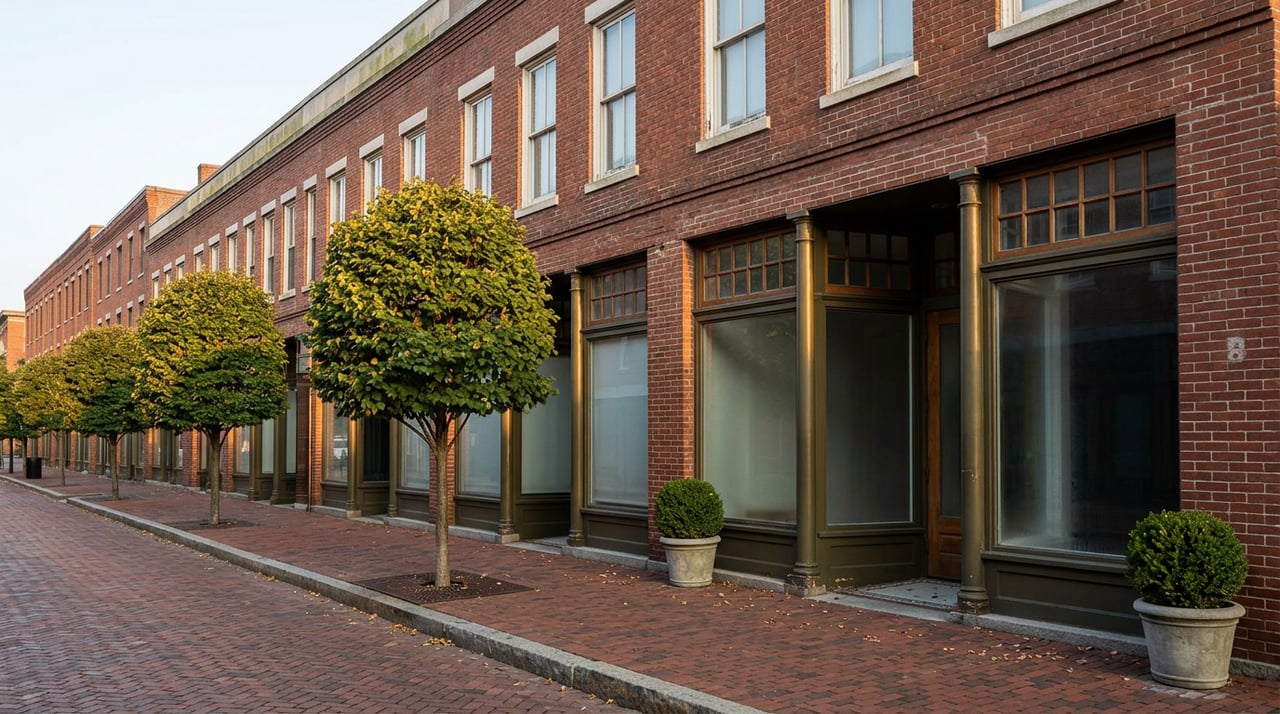
Let's find your address on this block.

Zander Realty Group tracks Back Bay's off-market inventory alongside the public listings above. Tell us what you're building toward, and we'll bring you the comparables that matter.

530 Washington Street, Suite #3 · Stoughton, MA 02072
(617) 405-3054 · [email protected]
© 2026 Zander Realty Group

Work With Us

Are you interested in buying or selling in Greater Boston, MA? We'd be pleased to become your trusted real estate resource. We look forward to connecting with you!

Follow Me on Instagram